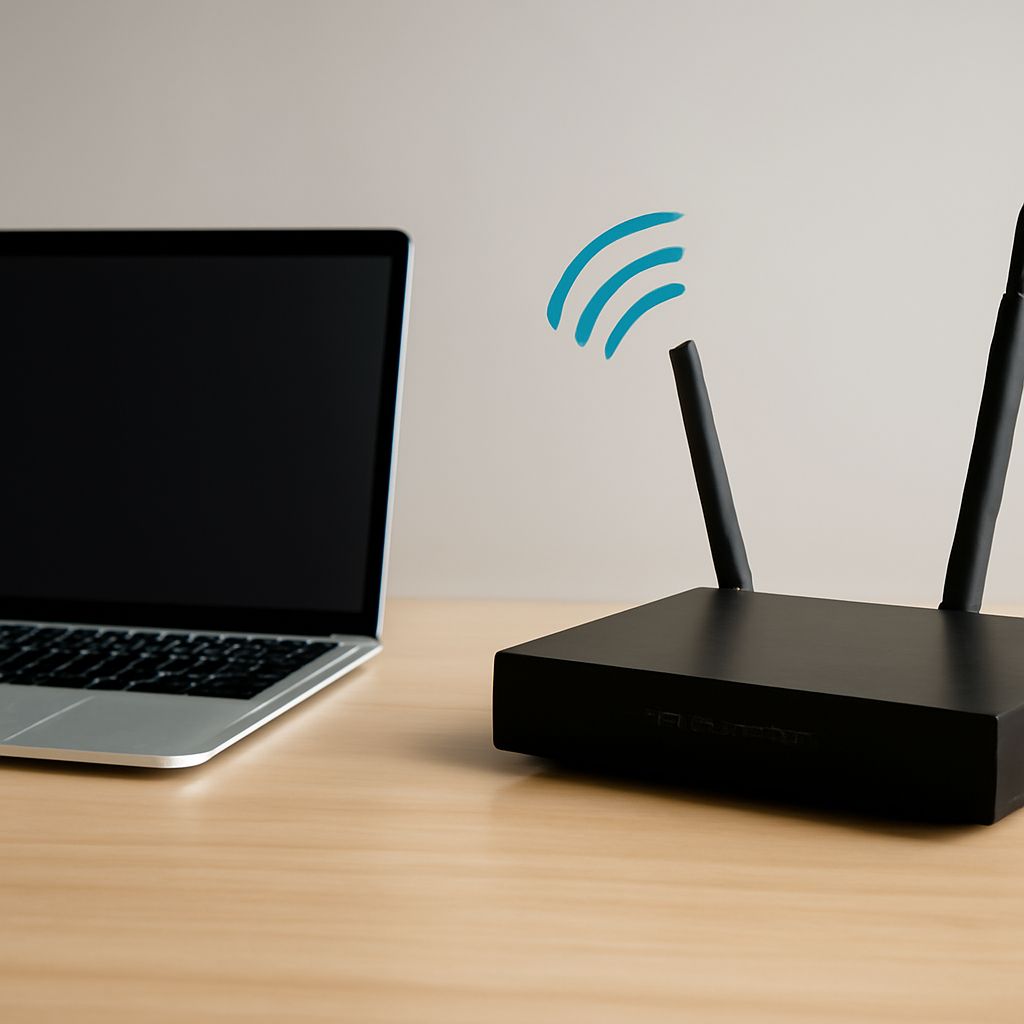
A spectrum analyzer tutorial starts with one practical idea: the instrument shows signal energy by frequency and level. For a 2.437 GHz Wi-Fi channel, you can center the display on 2.437 GHz, choose a span wide enough to see the channel and nearby interference, and adjust the reference level so the trace fits without overloading the input.
Choose a swept analyzer for broad, slower measurements; choose a real time spectrum analyzer for brief or intermittent events. For coaxial television or broadband service, a cable signal strength meter is usually faster and more useful than a general RF analyzer. Software can display measurements, but it needs an RF receiver or recorded data to measure radio signals.
Spectrum Analyzer Tutorial: What Does the Display Show?
Frequency and amplitude axes
The horizontal frequency axis shows where energy occurs. Its center is the selected center frequency, and its total visible width is the span. The vertical amplitude axis shows signal level, commonly in dBm for RF equipment. A higher trace means more power at that frequency.
On the 2.437 GHz example, a 20 MHz-wide Wi-Fi signal appears as a broad raised shape rather than a single thin line. A narrow unwanted carrier might appear as a sharp peak beside it. The display’s bottom region is the noise floor: the analyzer’s own residual response plus ambient and receiver noise. Signals close to that floor may be difficult to distinguish reliably.
Read the peak, noise floor, and occupied bandwidth
Use the marker to read a peak’s frequency and amplitude. Occupied bandwidth describes the frequency range containing a chosen percentage of a signal’s power, so it is different from the analyzer’s span. A wide span helps find unknown signals; a narrower span gives more detail around a known one.
How Do You Set Center Frequency, Span, and Reference Level?
Start with a 2.437 GHz Wi-Fi signal
- Set the center frequency to 2.437 GHz, the middle of the channel you want to inspect.
- Set the span to about 40 MHz so the 20 MHz signal and nearby interference are visible.
- Set the reference level, the top value on the amplitude axis, above the expected signal. For a signal near -40 dBm, a -20 dBm reference level gives useful headroom.
The reference level is not the same as the measured signal level. It establishes the display’s top boundary and often controls the analyzer’s input attenuation. If the trace touches the top edge, reduce the input level with more internal or external attenuation, then recheck the reading.
Set resolution bandwidth and verify the noise floor
Resolution bandwidth (RBW) is the width of the filter used to separate nearby signals. A smaller RBW resolves closer carriers and lowers displayed noise, but it usually makes a swept measurement slower. Start with an RBW such as 100 kHz for a general view of the Wi-Fi example, then reduce it when examining narrow interference. Confirm that the noise floor stays comfortably below the signal.
Check input range before adding attenuation
Before connecting an unknown or high-level source, check the analyzer’s maximum input range, connector limits, and any DC-input restriction. Do not connect an unknown high-level signal directly to the input without accounting for its input range and the attenuation required. Use a suitable attenuator, coupler, or probe, and include its loss when interpreting the level.
Swept Analysis or a real time spectrum analyzer: Which Do You Need?
Swept measurements for broad coverage and slower events
A swept analyzer tunes through a selected frequency range, measuring one portion after another. It is efficient for checking harmonics, filter response, transmitter output, and a wide band where signals remain present long enough to be sampled. Narrow RBW settings, wide spans, and slow or changing signals can increase sweep time.
Real-time capture for brief or intermittent interference
A real-time spectrum analyzer digitizes a continuous time window and analyzes it without waiting for a conventional sweep to visit each frequency. It can capture short bursts, hopping signals, pulsed interference, and events that appear only occasionally. Look for features such as spectrogram history, persistence, trigger, and probability-of-intercept performance. It generally costs more and may cover less bandwidth at high resolution than a swept instrument.
When Is a Cable Signal Strength Meter the Better Choice?
Use service-specific channel and level readings
Use a cable signal strength meter when diagnosing coaxial cable television, DOCSIS, or satellite distribution. It tunes known channels and commonly reports level in dBmV or dBµV, channel power, tilt, and sometimes MER and BER. These readings match service limits more directly than a general spectrum trace.
A meter such as the Viavi OneExpert CATV is built around field tests, while a general analyzer is better for finding unknown interference or inspecting a broad RF environment. Follow the system’s channel plan and impedance requirements. A cable meter is not a universal replacement for an RF analyzer: it may not reveal out-of-band emissions, and an analyzer may not provide the service-specific quality tests needed for a channel repair.
What Does Free Spectrum Analyzer Software Need to Work?
RF receiver hardware for actual measurements
Free spectrum analyzer software provides controls and a display, not an antenna, tuner, or analog-to-digital converter. For live RF measurements, pair software such as SDR++, GNU Radio, or inspectrum with compatible hardware such as an RTL-SDR Blog V4, Airspy, or HackRF One. The receiver determines frequency coverage, sample rate, dynamic range, and maximum safe input. Check those limits before connecting an antenna, feed line, or transmitter output.
Audio-only and display-only software limitations
Audio spectrum applications analyze the sound-card range, typically about 20 Hz to 20 kHz; they cannot inspect a 2.437 GHz Wi-Fi signal without an RF downconverter or receiver. Display-only programs can plot IQ samples, CSV files, or network data, but they still depend on another device to collect the measurements. For RF diagnosis, choose software that supports the receiver’s driver and provides a visible noise floor, adjustable span, RBW or FFT controls, and recording or waterfall views when intermittent faults matter.