Dish signal strength, cable signal strength, RF spectrum analyzer readings, and phone signal strength answer different diagnostic questions. A satellite receiver may show a proprietary percentage, a cable meter reports level in dBmV or dBµV, an RF spectrum analyzer displays amplitude across frequency, and a phone reports radio measurements such as dBm. Treat each reading as a baseline for its own system, not as an interchangeable unit.
To isolate a weak link, measure the same channel, transponder, frequency, or mobile band at two points. Record the level, quality or noise result, and error reading together. A change between the source and endpoint identifies loss, while a change at only one frequency or location points to interference, a damaged cable, or coverage conditions.
Dish signal strength: compare receiver level, quality, noise, and errors
A satellite receiver or satellite meter commonly reports strength and quality as percentages or bars. These are usually proprietary relative scales. Some professional meters instead show calibrated level in dBµV or dBm and carrier-to-noise ratio in dB, but a receiver’s 75% is not directly comparable with a cable reading of 5 dBmV or an analyzer reading of -50 dBm.
- Level or strength: the receiver’s estimate of input power from the LNB and coaxial path.
- Quality: how clearly the wanted carrier can be decoded, often related to C/N or SNR, symbol lock, and modulation performance.
- Noise and interference: unwanted energy that can reduce quality even when the level appears high.
- Errors: BER, uncorrected blocks, or packet errors show whether the received data is actually reliable.
For a useful comparison, lock the same satellite and transponder at the dish, then check the receiver end of the coax. Keep polarization, frequency, and receiver settings unchanged. A large drop in strength with similar quality suggests cable, connector, splitter, or LNB-output loss. Normal strength with falling quality or rising errors suggests dish misalignment, an obstructed view, LNB noise, or interference. Compare several transponders because a fault affecting only part of the band may not appear on every service.
Cable signal strength: read dBmV, dBµV, channel level, and tilt
Use a 75-ohm cable meter or service monitor to measure channel level. Cable systems commonly use dBmV, meaning power relative to 1 millivolt, or dBµV, meaning power relative to 1 microvolt. For the same 75-ohm signal, dBµV is 60 dB higher than dBmV. A reading of 0 dBmV therefore equals 60 dBµV.
Digital cable channel levels may be shown as average power across the channel bandwidth. The number indicates level, not whether the data will decode correctly. Check MER or SNR for modulation quality and BER or uncorrectable errors for data performance. A level within the expected range can still fail when ingress noise, reflections, or distortion reduces MER.
Many residential systems aim for approximately -10 to +10 dBmV at a service outlet, but the correct limit depends on the provider, channel plan, and equipment. Measure the same channels at the tap, splitter output, and wall outlet. A similar loss across all channels points to a connector, splitter, or long coax run. A slope in which higher frequencies lose more level is called tilt and can indicate cable attenuation or equalization problems. A single damaged channel or narrow frequency group suggests a frequency-selective fault rather than general cable loss.
How to use an RF spectrum analyzer to spot noise and interference
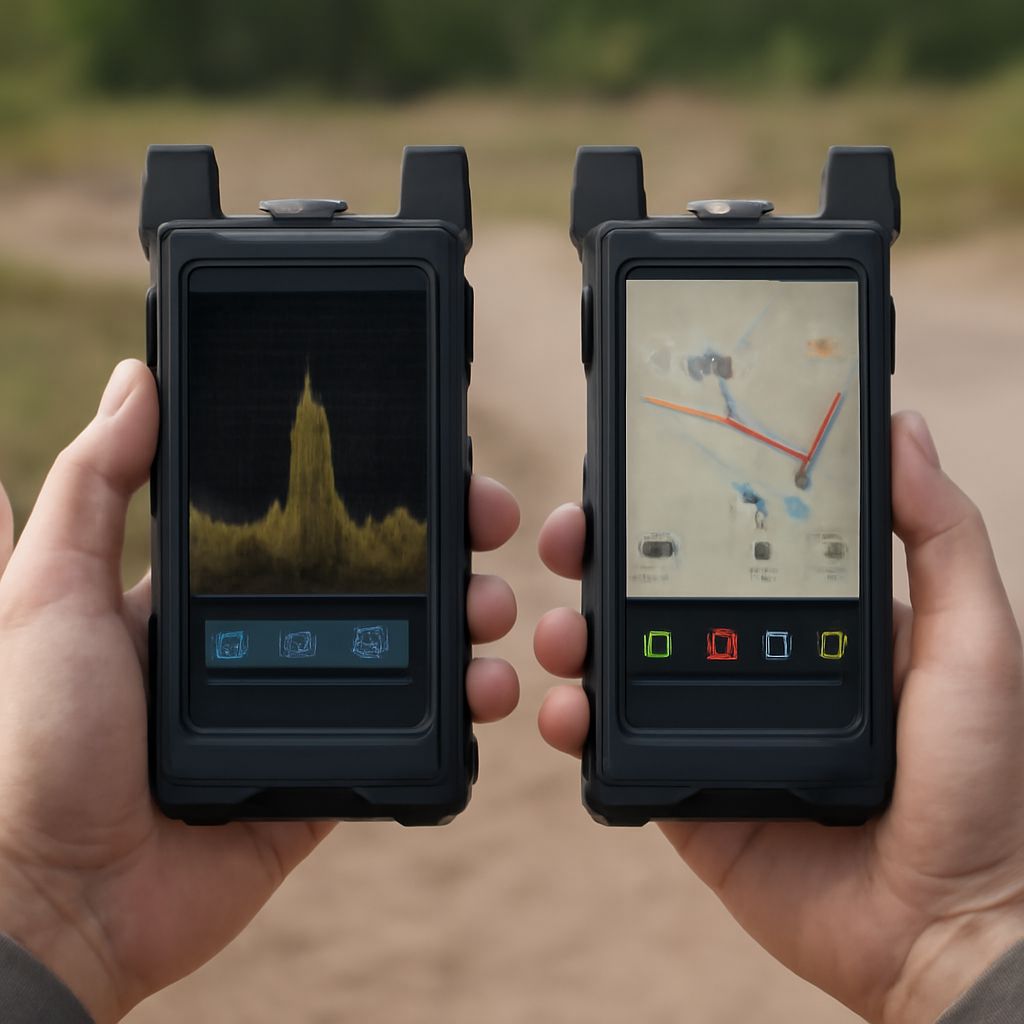
An RF spectrum analyzer measures amplitude across frequency and displays a trace rather than one service-quality percentage. Depending on its input configuration, the vertical scale may be dBm, dBmV, or dBµV. Set the correct impedance, frequency range, reference level, resolution bandwidth, and attenuation before comparing traces. A 50-ohm dBm reading should not be treated as a 75-ohm cable reading without the appropriate setup.
- Wanted carrier: its height, width, and shape show level and occupied bandwidth.
- Noise floor: the background level between carriers shows how much unwanted energy is present.
- Interference: a spur, raised band, periodic peak, or ingress signal may identify an external source.
- Overload or distortion: multiple unexpected peaks can result from excessive input level or analyzer settings.
Save a clean trace at the source, then repeat it at the cable endpoint or antenna location with the same settings. A uniform drop indicates path loss. A raised noise floor at only one point indicates local interference or shielding failure. A new narrow peak identifies an interfering frequency; a broad rise may indicate ingress or a noisy amplifier. The analyzer shows RF conditions, but a communications meter may still be needed to measure MER, BER, or demodulation errors.
Phone signal strength in dBm: compare locations and coverage
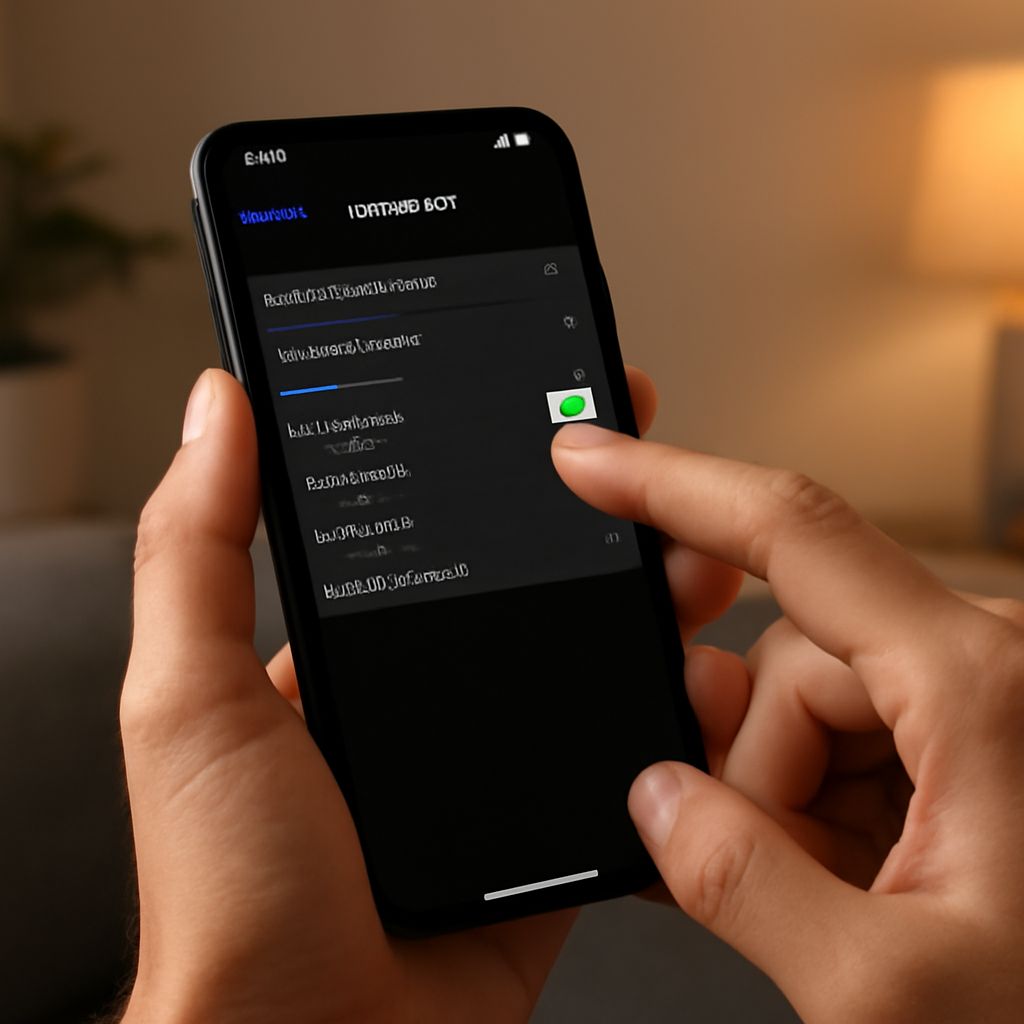
Use the phone’s field-test screen or a network diagnostic app to view cellular level. Phone signal strength is commonly reported in dBm, a logarithmic power measurement referenced to 1 milliwatt. Because cellular power is small, values are negative: -70 dBm is stronger than -100 dBm. As a rough guide, -50 to -80 dBm is strong, -90 to -105 dBm is weak to usable, and readings near -110 dBm or lower often produce unreliable service. Phone models and networks apply different thresholds.
For LTE and 5G, RSRP is generally more useful for coverage comparison than RSSI. RSSI can include the wanted signal, neighboring signals, and noise. Also record RSRQ or SINR: a strong RSRP with poor SINR can still produce slow data when interference or congestion is present.
Compare the same phone, carrier, band, and orientation at each location. Log readings outdoors, near a window, and at the problem spot. A consistent dBm drop indoors points to building attenuation or distance from the cell site. Similar level with worse SINR points to interference or congestion. Compare readings over several moments rather than relying on one value while the phone changes bands or cells.